Dave Hudsonhashingit.com |
Strange spikes revisited!
About 3 months ago I looked at how the BTC price seems to spike up approximately every 7 months. It seems to be happening again!
Over the last couple of weeks the BTC price has reversed its earlier falls and has yet again started to jump back up again. The timing is pretty-much consistent with previous spikes.
Let’s look at the graph (plotted on a logarithmic Y axis):
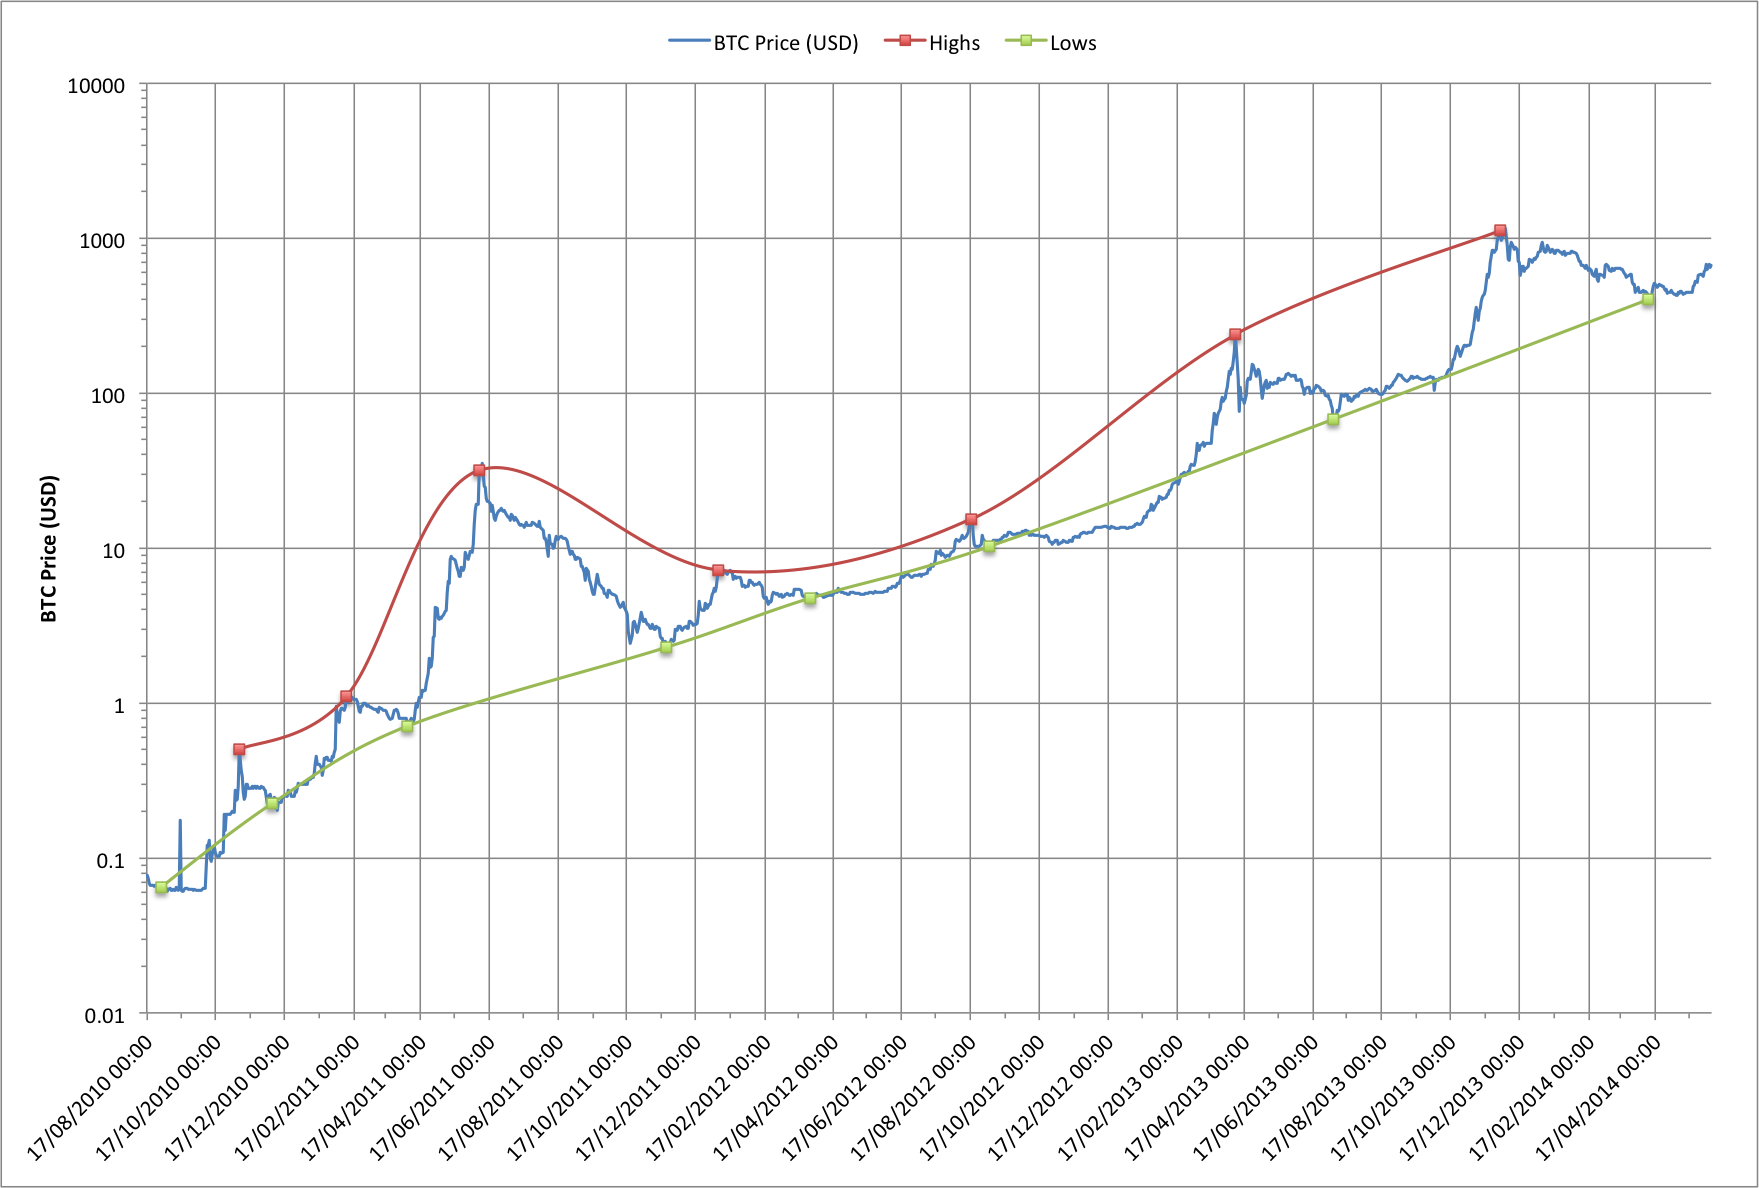
The trend of high points in the graph (red line) shows another theme park ride: The Bitcoin runaway roller coaster. Like any good thrill ride we see regular highs and lows; here the peaks are anywhere between 212 days and 235 days, but in general the later ones have been nearer 235 days. 235 days from the last high would be 2014-07-24. It will be interesting to see if the current rises follow the same trend and if that’s near our next destination.
While our roller coaster may be an entertaining ride for many, the gentle slopes of the low point trend (green line) form an intriguingly steady path. Perhaps it’s this trend that should be attracting far more attention?
Data reference
Data for this article was sourced via blockchain.info